
Food Supplement Comparison Study
by Justin Hall of UW-Steven’s Point.
Comparison of three carbon sources and their effectiveness at wastewater treatment in batch reactors. Food supplements tested include; Molasses, Old Roy dog food, and Aquafix’s SmartBOD.
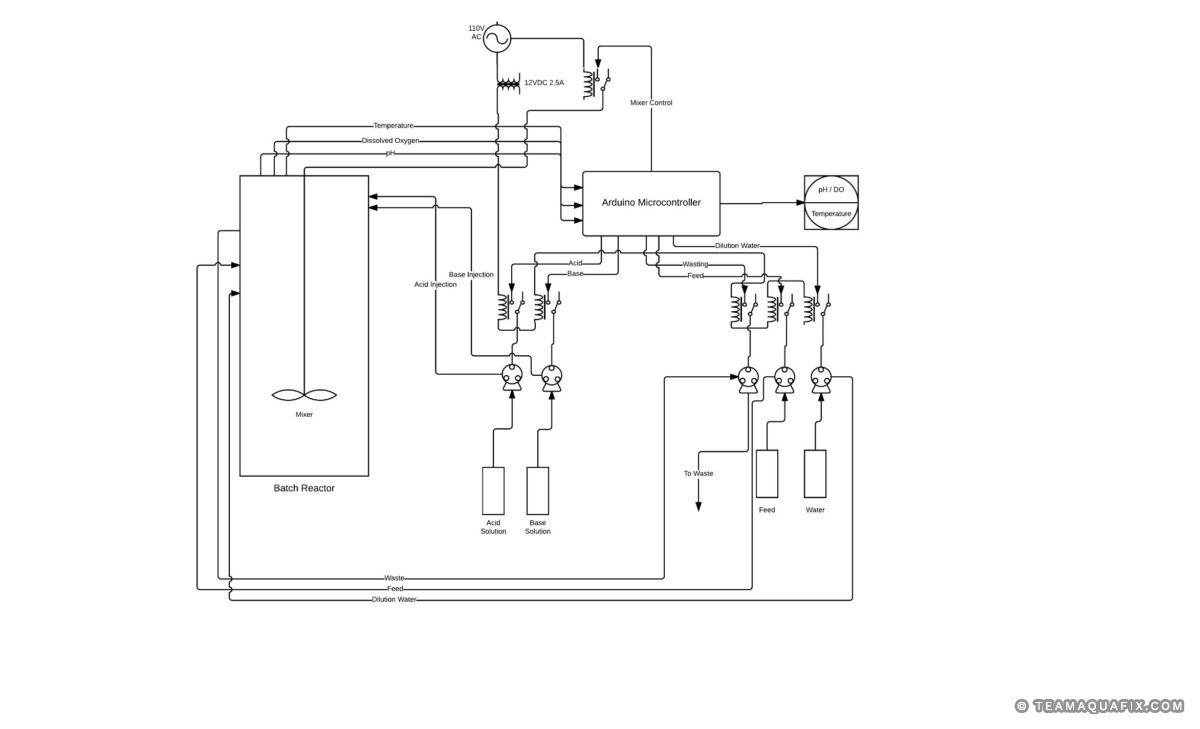
Reactor Design
Three batch reactors were constructed using 6” PVC pipe with a total volume of approximately 7L and a working volume of 5L. The reactors each had independent pH and dissolved oxygen controls in addition to monitoring temperature. A custom microcontroller interface was designed to control reactor set points, and to view real time sensor output.
Wastewater was obtained from the Stevens Point, Wisconsin municipal wastewater treatment facilitiy. The wastewater was diluted to 1500 mg/L MLSS concentration prior to the study start using city tap water.
Experimental Conditions
Three different food supplements (carbon supplements) were used; molasses, Old Roy dog food, and SmartBOD. The reactors had the following controls; pH, dissolved oxygen, and mixing. Temperature was monitored but not controlled. Mixing was achieved from an overhead mixer, and aeration (when active). Conditions for the reactors are listed in Table 1.
Table 1: Experimental conditions
Parameter
Setpoint
The amount of each food supplement differed based on supplied BOD values. Table 2 illustrates volumes added to each reactor per day to achieve a BOD concentration of 250 mg BOD / day.
Table 2: Volumes of food added to reactors
Food Source
BOD mg/g
Food Added g/day
Food Slurry mL/day
Dilution Water mL/day
Each reactor completed three cycles daily consisting of; of treatment, settling, decant, and feed/dilution phases. Each cycle lasted eight hours. Reactors settled for 30 minutes before decanting occurred. The feed and dilution phases occurred simultaneously.
Test Methods
Reactors were tested for the following; ammonia, reactive phosphorus, chemical oxygen demand, flora count, mixed liquor suspend solids, and sludge volume index. Table 3 lists the method used for each test.
Table 3: List of methods
Test
Method
Ammonium and Reactive Phosphorus
Samples were collected from reactor effluent, filtered through a 0.45 µm membrane filter and preserved to a pH of < 2.0 with 1:1 H2SO4. Samples were analyzed by the Water and Environmental Analysis Laboratory located on the University of Wisconsin – Stevens Point campus.
Chemical Oxygen Demand
Reactor effluent samples were collected, filtered, and preserved with H2SO4 and refrigerated at 4°C until the time they could be analyzed. Chemical oxygen demand samples were analyzed in house.
Flora Count
A flora count was completed, using a method developed by Toni Glymph. Three slides were analyzed for each reactor’s MLSS. The different species of flora observed were tallied and averaged over the three slides. These results are reported as percent of total flora.
Mixed Liquor Suspended Solids
Samples of Mixed Liquor were removed from the reactor. The volume removed from the reactor was replaced with tap water to keep the 5L volume of the reactors consistent. Reactors were wasted as needed to keep MLSS at 1500 mg/L.
Sludge Volume Index
1L of the mixed liquor was removed from the reactor and allowed to settle for 30 minutes. The samples were then returned to the reactors.
Spectroscopy
An attempt was made to compare the MLSS values obtained from SM2540 D to uv-vis spectroscopy. Data was collected during the study, however it proved to be inconclusive. It was realized that during the study a background correction needed to be obtained to correct for color that developed in the reactors. Work on the comparison of absorbance values to MLSS concentrations will continue in future studies while correcting for background color.
Results & Discussion
Ammonium and Reactive Phosphorus
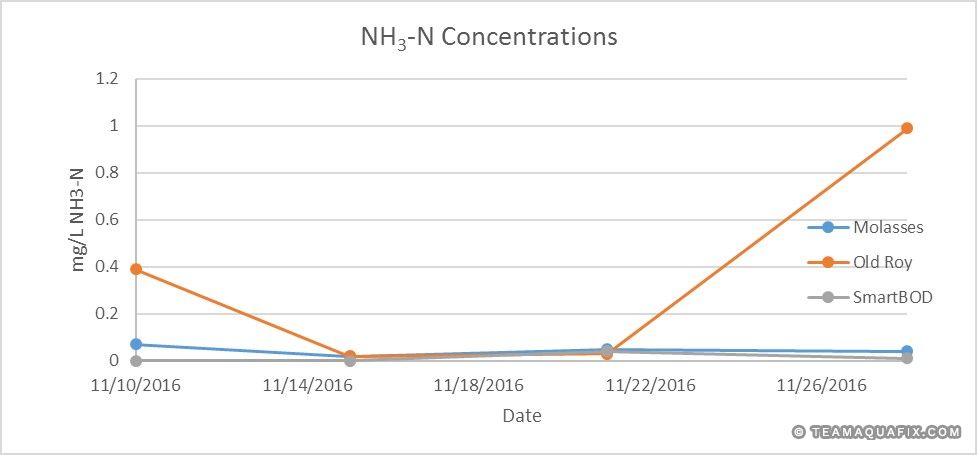
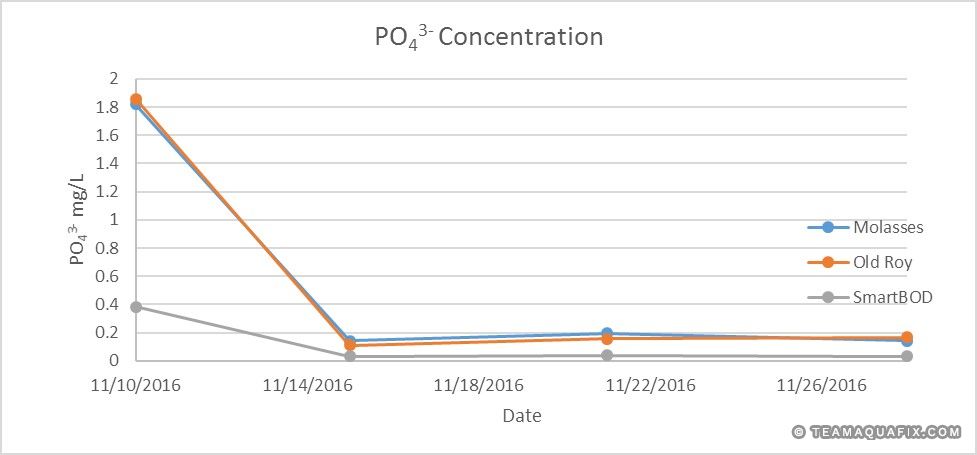
Effluent ammonium and reactive phosphorus were analyzed. Table 4 shows concentrations of each sample analyzed. It is unclear why the initial samples had high levels of ammonium and phosphorus in reactor effluent compared to later sample dates. It is possible that there was still carry over from the MLSS seed obtained from the Stevens Point wastewater treatment plant.
Ammonium did appear to accumulate in the reactor containing the Old Roy dog food, with low levels observed in the rest of the carbon supplement samples. Phosphorus accumulated in the reactor containing the dog food and molasses. Besides the initial sample, low concentrations of ammonium and phosphorus were observed with SmartBOD.
Table 4: Ammonium and reactive phosphorus concentrations in reactor effluent
Date
NH3-N (mg/L)
Molasses
NH3-N (mg/L)
Ol'Roy
NH3-N (mg/L)
PO43- (mg/L)
Molasses
PO43- (mg/L)
Ol'Roy
PO43- (mg/L)
SmartBOD
Chemical Oxygen Demand
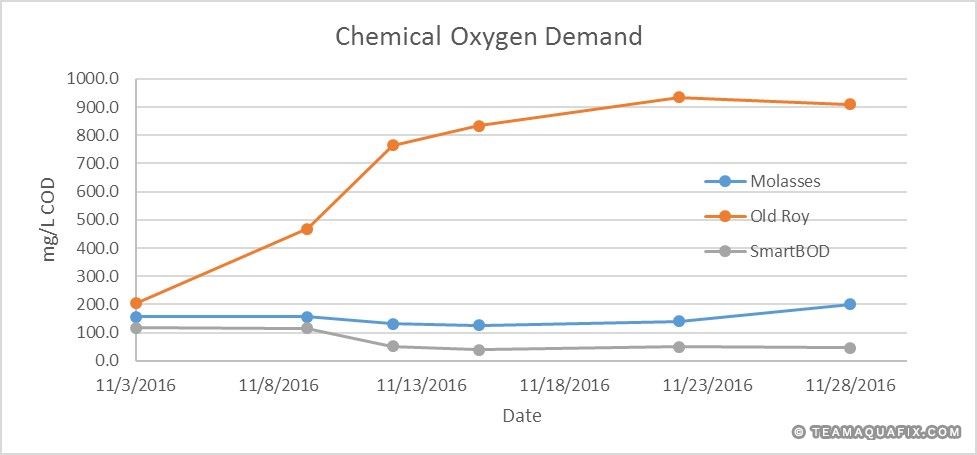
Effluent chemical oxygen demand was tested as a metric for the efficiency of treatment of the wastewater in the reactors. The reactor with the Old Roy dog food showed a clear increase in COD throughout the study, to nearly 1000 mg/L. This would indicate that treatment was not complete during reactor cycles and continued to accumulate. Both the molasses and the SmartBOD food supplements had low levels of COD in their effluent. All of the SmartBOD values, except for November 3rd and 9th were below 100mg/L COD, the rest were near or below 50 mg/L COD. This would indicate continuous, effective removal of the COD from the wastewater. Table 5 and Figure 4 contain COD results.
Date
COD (mg/L)
Molasses
COD (mg/L)
Ol'Roy
COD (mg/L)
SmartBOD
Flora Count
Microscope analysis of the MLSS was completed to look at the flora present in each reactor. The types of flora present can indicate the relative age, and health of sludge. Healthier, younger sludges tend to have more flagellates and ciliates, where older, less healthy sludges tend to have more amoebas, and metazoa.
Table 6: Flora count of MLSS. Results listed as a percent of total count. Molasses (Rx1), Old Roy (Rx2), and SmartBOD (Rx3)
Date
Amoeba
Rx1
Amoeba
Rx2
Amoeba
Rx3
Flagellate
Rx1
Flagellate
Rx2
Flagellate
Rx3
Free Swimming Ciliates
Rx1
Free Swimming Ciliates
Rx2
Free Swimming Ciliates
Rx3
Date
Crawling Ciliates
Rx1
Crawling Ciliates
Rx2
Crawling Ciliates
Rx3
Stalked Ciliates
Rx1
Stalked Ciliates
Rx2
Stalked Ciliates
Rx3
Free Swimming Ciliates
Rx1
Free Swimming Ciliates
Rx2
Free Swimming Ciliates
Rx3
Sludge Volume Index
Sludge volume index (SVI) is an additional metric that can be monitored to characterize the health of wastewater sludge. SVI is the volume of solids that are occupied after a 30-minute settling period, in milliliters. Table 7 has general guidelines for the results from a SVI test.
Table 7: General guidelines for SVI
SVI
Sludge Characteristic
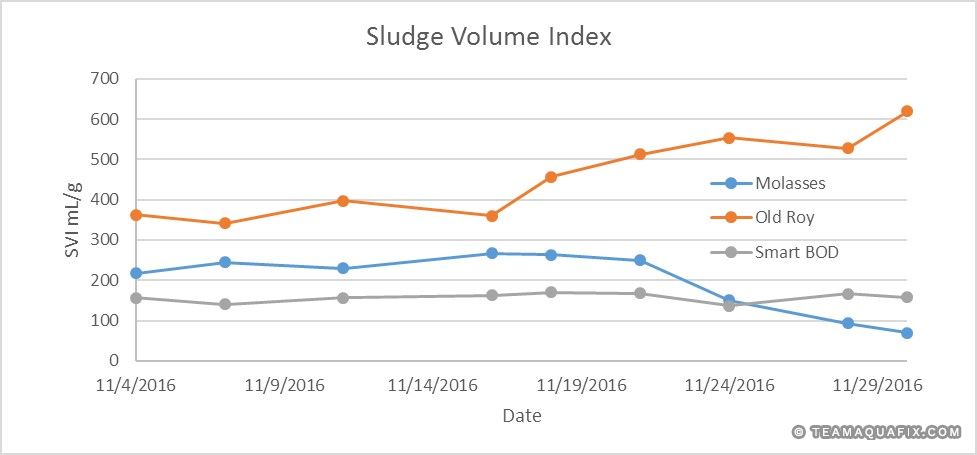
The reactor fed with the molasses carbon supplement for the first part of the study had a slightly higher SVI then SmartBOD. During the test, good settling was noted with both reactors. However, after a slow increase in SVI, the SVI rapidly decreased to less than 100 mL/g. A dense mass was observed after the 30-minute settling period. During this same time, it was noted that during the MLSS testing for the reactor fed with molasses became difficult to filter. A possible cause for this is from the formation of filamentous bacteria. SmartBOD maintained a SVI in the ideal range of 100 to 200 mL/g for the duration of the study.
Old Roy dog food saw a continual increase in stability. Poor floc formation and poor settling were observed during testing. Table 8 and Figure 5 illustrate the SVI from the study.
Table 8: Sludge volume indices
Date
SVI (mL/g)
Molasses
SVI (mL/g)
Ol'Roy
SVI (mL/g)
SmartBOD
Figure 5: Sludge volume indices
Conclusion: Food Supplements
The addition of SmartBOD as a food supplement outperformed molasses and Old Roy dog food when comparing the metrics of COD removal, nutrient accumulation and settling properties. The clearest advantage is when comparing it to the use of Old Roy dog food. The dog food reactor had high levels of solids, nutrient build up, and high levels of COD in the reactor effluent. All of these factors indicate that there was only partial treatment in the reactor containing the Old Roy dog food.
SmartBOD and molasses have similar levels of nutrient removal and a slightly less COD removal efficiency. The SmartBOD outperforms the molasses when it comes to the settling of the sludge. The SVI for the SmartBOD is right in the ‘sweet spot’ indicative of healthy sludge.
Concluding, the evidence from this study supports that the SmartBOD is a more efficient food supplement when compared to Old Roy dog food and molasses.
Please advise if there is a black diamond at the substance.
No , there is no black diamond in our SmartBOD.