
Fatty Acid and Grease Removal in Wastewater
by Justin Hall of UW-Steven’s Point.
Summary
The presence of fats, oils, and greases (FOG) is a major concern for the municipal wastewater treatment plants. Presence of FOG in waste water treatment systems can lead to buildups which can cause blockages and ineffective wastewater treatment. The point of entry of these FOG can be from numerous sources such as; industry, restaurants and homeowners. Regardless of the source, once it reaches the treatment facility it can be difficult to remove.
The presence of these FOG, especially in colder weather conditions can cause for less desirable wastewater flora to form such as the filaments Microthrix parvicella and Nocardia. This is because the ‘good’ bacteria that are responsible for the treatment of wastewater have a difficult time breaking down fats, oils and grease. Filamentous bacteria can also be responsible for the presence of foam in wastewater treatment processes because of their ability to float on the surface.
The objective of this study was to determine the effectiveness of the Qwik-Zyme L (QZL) biocatalyst, a wastewater additive developed and produced by AquaFix Inc. The addition of QZL, according to product labeling, aids in the removal of fats, oils and greases from wastewater. This study was developed at the Wisconsin Institute for Sustainable Technology (WIST) at the University of Wisconsin – Stevens Point. A total of nine different sources of fats were tested. Seven sourced from non-animal, with two sourced from animal products.
This study tested the removal of fatty acids from spiked wastewater samples over a 24-hour period. Wastewater with the QZL added was compared to wastewater without the addition of the biocatalyst. Analysis of the fatty acid loss after the treatment period indicated that the addition of the QZL biocatalyst was effective in aiding in the removal of fatty acids.
Results
Only trace amounts of short chained fatty acids (SCFA) were observed during the study. Due to no quantifiable levels of SCFA having been detected their results will not be individually listed.
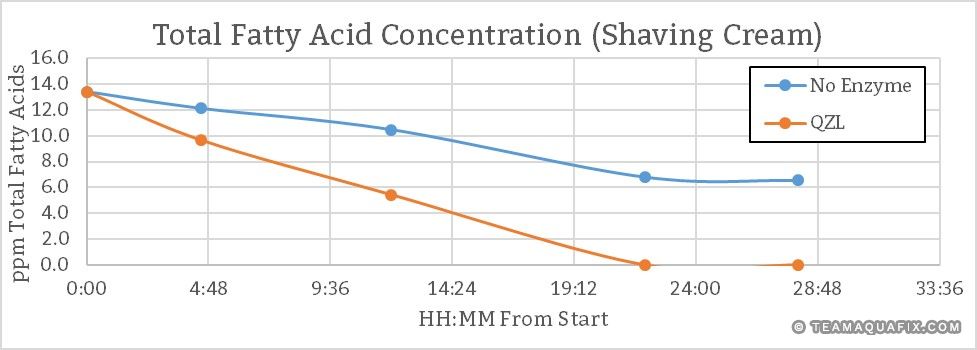
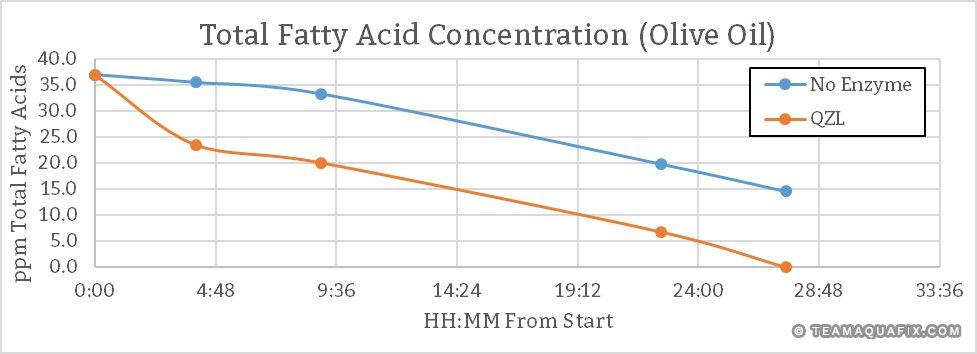
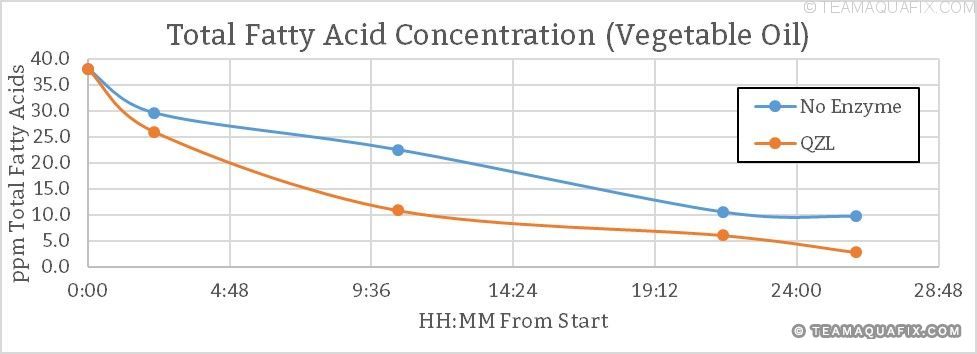
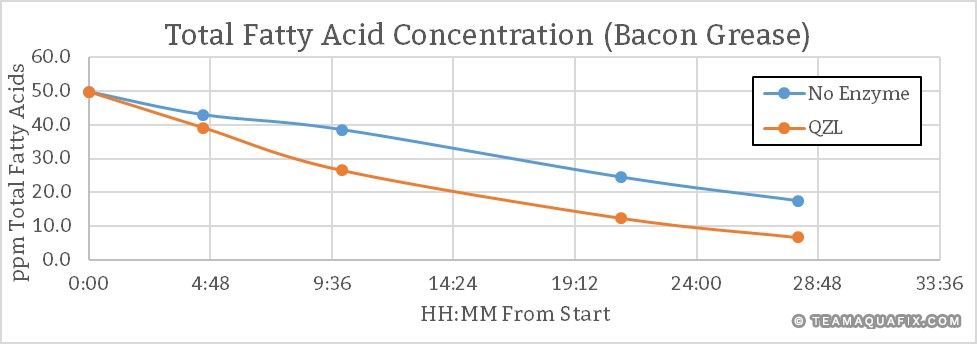
The following graphs illustrate the degradation of the fatty acids present in the wastewater over a 24-hour time period.
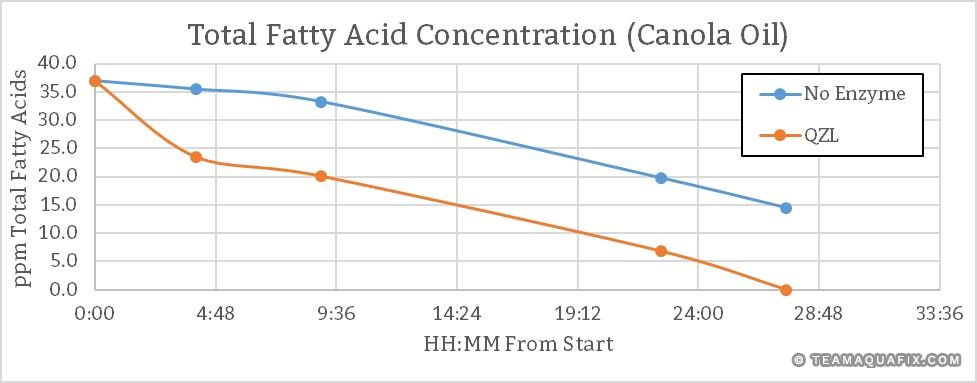
Canola Oil
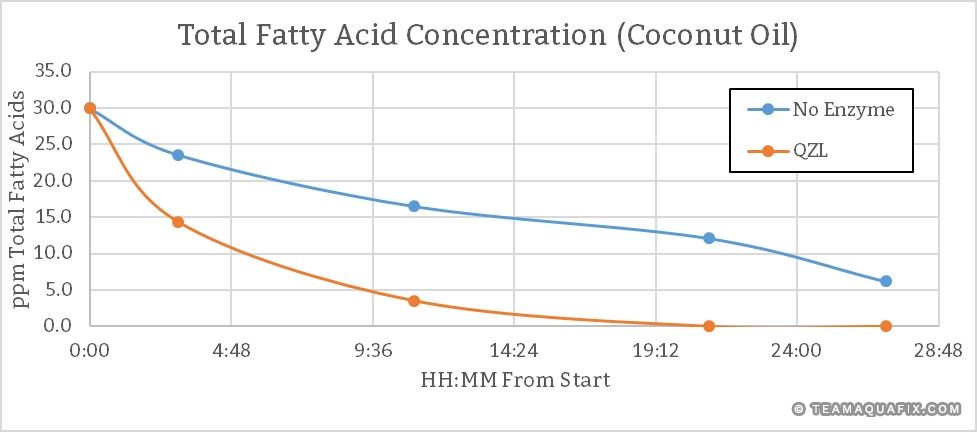
Coconut Oil
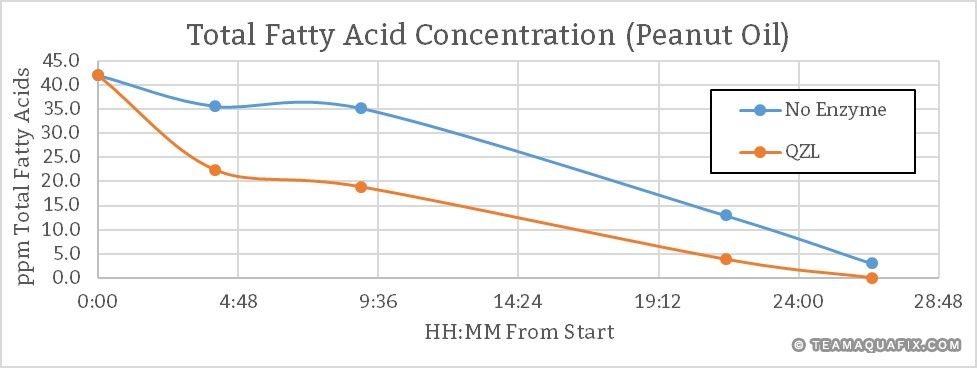
Peanut Oil
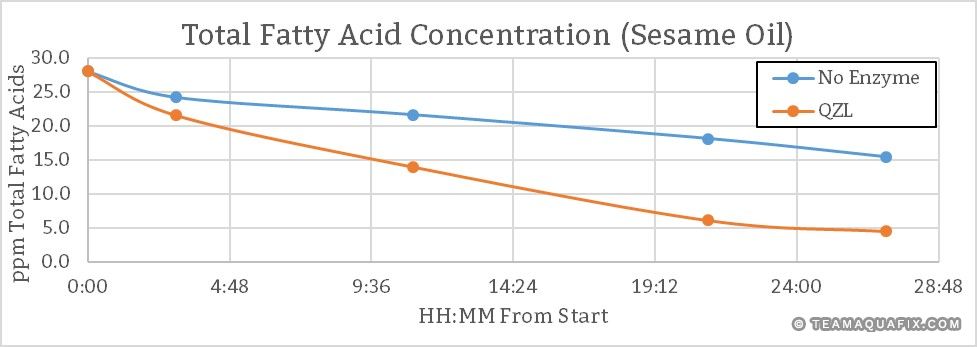
Sesame Oil
Shaving Cream
Olive Oil
Vegetable Oil
Bacon Grease
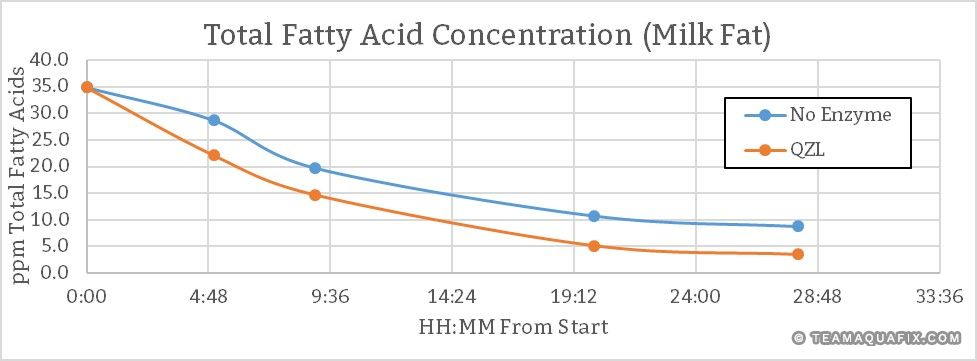
Milk Fat
COD Removal
Conclusion
In all of the fat sources tested the addition of the QZL biocatalyst aided in the removal fatty acids from wastewater. The biocatalyst appears to aid in the reduction of the fatty acids relatively quickly, increasing the rate of fatty acid removal during the first hours of treatment.
The first samples for fatty acid testing were drawn at about four hours into treatment. Table 12 shows the percent removal at the first sampling for fatty acids.
The effectiveness of the QZL biocatalyst continued for the duration of the treatment. At the end of the treatment period (approximately 24-28 hours) the fatty acid concentrations dropped below quantifiable limits in five of the nine fat sources. Table 13 shows the percentages of total fatty acids removed at the end of each treatment.
Appendix A – Experimental Conditions
Wastewater for this study was obtained from the Stevens Point, Wisconsin municipal wastewater treatment facility. Once in the laboratory, the wastewater was ‘washed’ to remove excess nutrients. Details of this procedure and others can be found in the methods section of this report.
MiniBio Reactors from Applikon Biotechnology were used to control conditions of the wastewater as listed in Table 14.
SmartBOD was added as a source of COD. 10,000 mg/L COD solutions were made and added to the wastewater to obtain the target of 400 mg/L COD.
Temperature was monitored during the study but not controlled. The ambient temperature of the laboratory where the experiments were conducted is usually between 19 and 22°C.
The study looked at a total of nine different sources of fats, seven from non-animal sources with the remaining two from animal. These were; olive oil, peanut oil, canola oil, shaving crème, coconut oil, vegetable oil, sesame oil, milkfat and bacon grease.
For each fat source tested the QZL biocatalyst was compared to a blank, or a wastewater sample with no biocatalyst added, with all other conditions remaining the same. Each test was completed in triplicate.
Appendix B – Test Methods
The reactors were tested for MLSS, chemical oxygen demand (COD), long-chained fatty acids (LCFA) and short-chained fatty acids (SCFA). Table 15 Lists the methods used for each analysis.
Short-Chained Fatty Acids
Samples for SCFA were filtered through a 0.22 µm membrane filter and analyzed on a DIONEX ICS-3000 chromatography system equipped with an ICE-AS1 column.
Long-Chained Fatty Acids
15 mL of wastewater was removed from the reactor vessel. This sample was then washed 3x with 5mL of hexane. Samples were centrifuged between hexane washings. The hexane fractions were collected in a separate tube and the hexane removed.
Once the hexane was removed 2.5 mL of 2.5% sulfuric acid in methanol was added as a derivatizing agent. Samples were placed in an incubated shaker table for 3 hours at 60°C. LCFA were back extracted by adding 1 to 2 mL of Hexane and vortexing.
The LCFA sample in hexane was ran on an Agilent 7890A GC system equipped with a FID detector and a DB-5 column.
MLSS Washing
Prior to using the mixed liquor obtained from the wastewater treatment facility it was ‘washed’ to remove excess nutrients. MLSS was poured into a 2L graduated cylinder and allowed to settle. Once settled the water was decanted and brought back to 2L with deionized water. This was done a total of three times.