BAI Engineering Study
by Xuehua Bai, PE
Purpose
The purposes of this technical memorandum are briefly outlined as:
- To evaluate the wastewater discharge payment method used by Metro Wastewater Reclamation District (METRO).
- To develop a wastewater discharge payment model applied to Industrial Park Water and Sanitation District (District).
- Based on the wastewater discharge payment model (Payment Model), to predict the District’s wastewater discharge payments for the pilot water quality improvement project that is currently performed at Ivy Lift Station. Five water quality data were collected. They are the BOD, TSS, and TKN data collected on March 21, 2019, May 10, 2019, May 15, 2019, May 21, 2019, and August 7, 2019.
- To determine if the Pilot water quality program is recommended to the District-wide application.
Wastewater Discharge Payment
The amounts wastewater discharge payments to the District are keep rising as shown in Table 1. The payment is calculated based on five wastewater qualities, including wastewater flow (Flow), biological oxygen demand (BOD), suspended solids (SS), Total Kjeldahl Nitrogen (TKN), and Metering and Sampling (CECU). METRO determines a unit charge for each parameter each year. The breakdown of the unit charge from METRO is also shown below in Table 1.
Table 1. METRO Wastewater Parameters Unit Charges
Parameters
2018 Unit Charge
2019 Unit Charge
Unit
METRO 2019 Wastewater Payment Formula
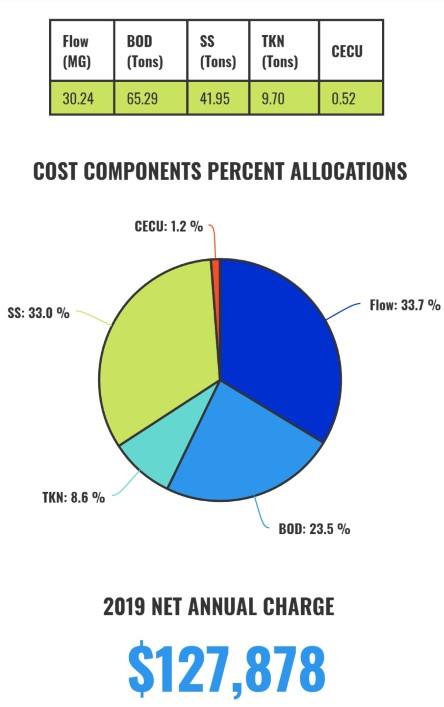
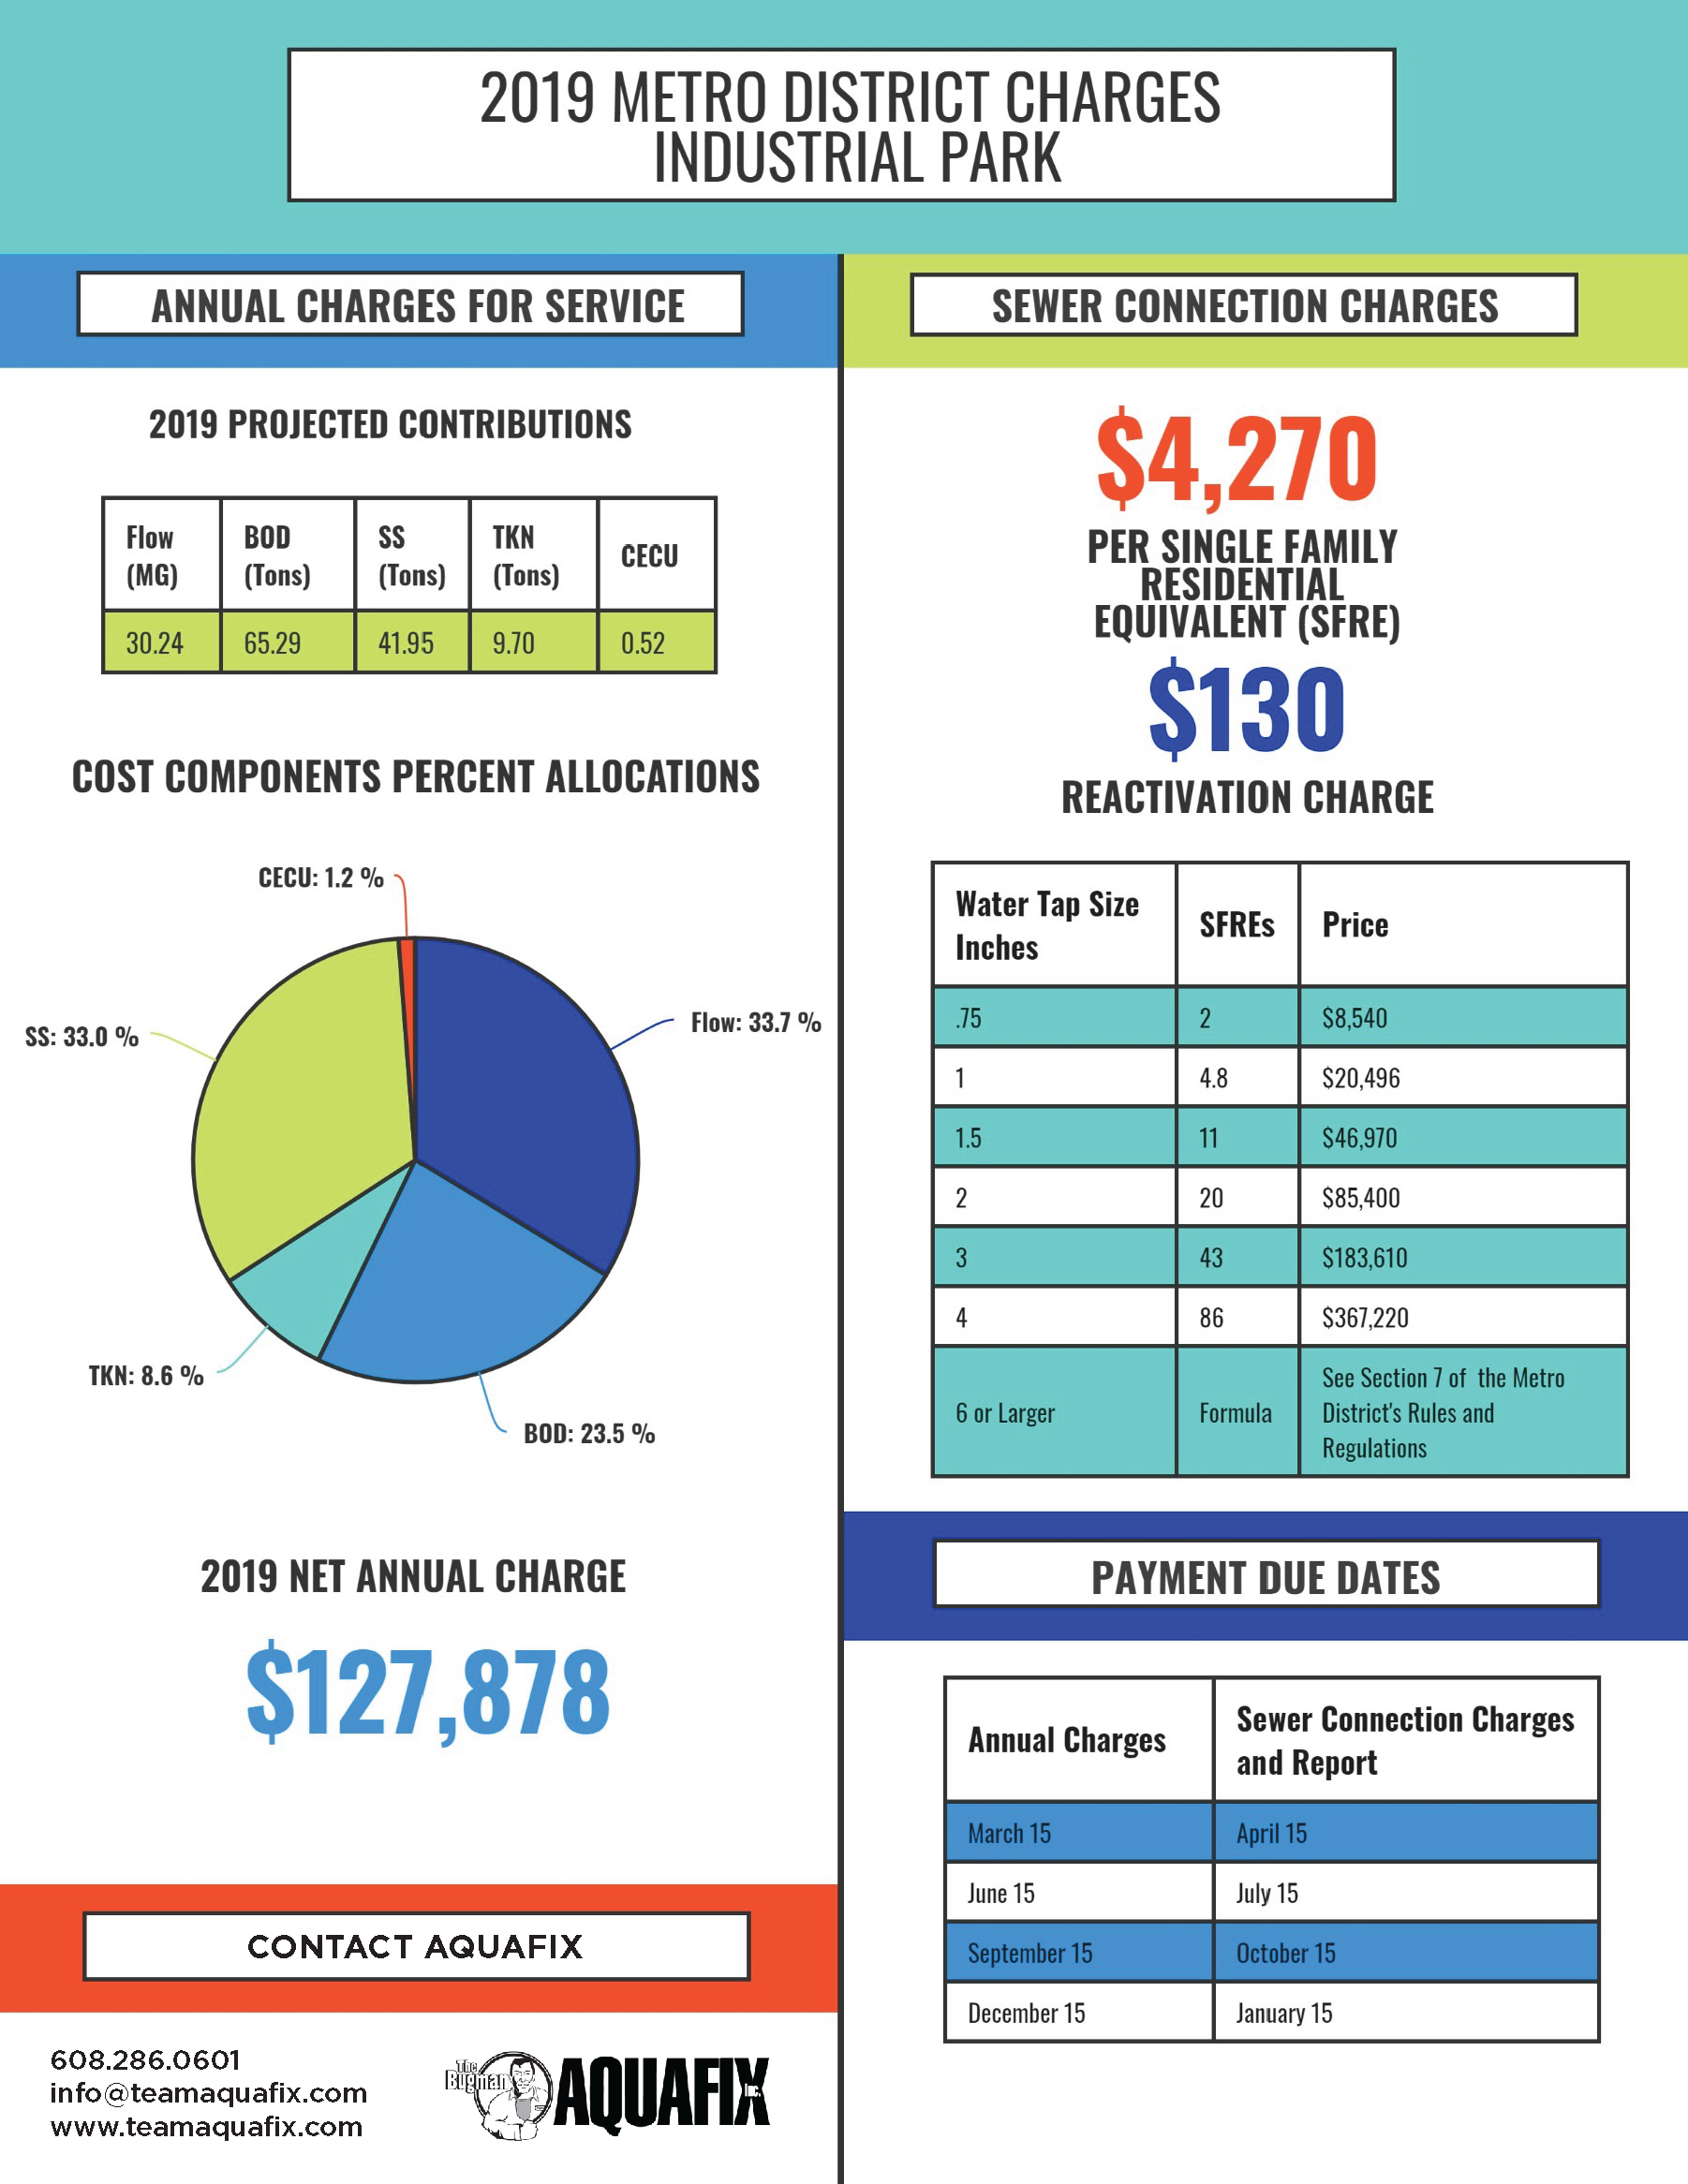
The District’s 2019 wastewater discharge payment provided by METRO is provided in Figure 1 and Appendix A.
Figure 1. District 2019 Wastewater Discharge Payment Posted by METRO

In summary, the wastewater discharge payment can be estimated by the following equation:
$$ = Total Flow * Flow Unit Charge + BODtot. * BOD Unit Charge + SStot. * SS Unit Charge
+ TKNtot. * TKN Unit Charge + CECU * CECU Unit Charge
METRO Wastewater Payment Model
Bai Engineers (BE) developed an excel spreadsheet model to predict the wastewater discharge payment for 2019 and future scenarios.
2019 Metro Payment Model
Using the total wastewater parameters provided in Figure 1, the District’s wastewater discharge payment modeled and summarized in Table 2.
Parameters
Total
Unit
Cost
The difference between METRO’s actual payment value ($127,878) and BE’s modeled payment valve ($125,035) is $2, 843 or 2.2%. The difference may due to rounding by METRO. (i.e. the total wastewater flow is rounded to two significant digit of 908.52 MG).
Recommendation
It is recommended the spreadsheet wastewater discharge payment model can be used for future payment scenario analysis.
Pilot Water Quality Improvement
The District conducted a pilot water quality improvement at Ivy Lift Station since June 19, 2019. The pilot water quality improvement project included:
- Installation of the Bug-on-a-rope since June 19, 2019, and
- Installation of the Liquid GreaseZilla since June 26, 2019.
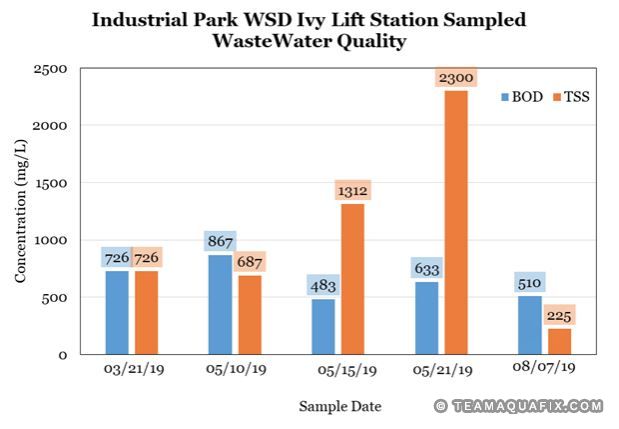
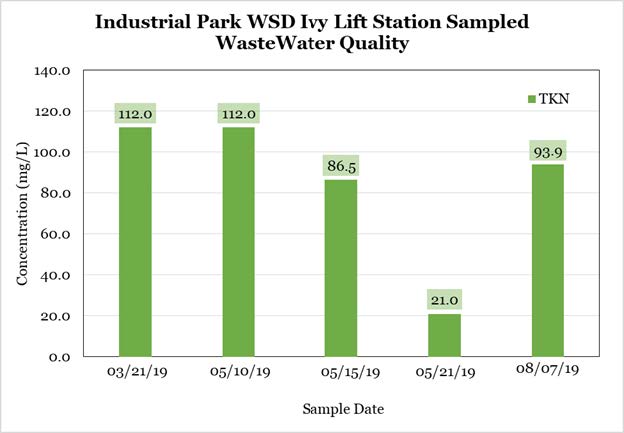
Detail information and data sheets about the Bug-on-a-rope and the Liquid GreaseZilla are provided in Appendix B. Five wastewater water samples were taken and analyzed. The water sample parameters are documented in Table 3 and Figure 2. Copies of the water quality data are provided in Appendix C.
Date
Date
Sampled Water Quality (mg/L)
BOD
Sampled Water Quality (mg/L)
TSS
Sampled Water Quality (mg/L)
TKN


As shown in Figure 2, the sample analyzed on May 15, 2019 and May 21, 2019 were identified as outliner due to the unreasonable low TKN and high TSS values. These two samples were excluded for this analysis.
Predicted METRO Payment per Pilot Water Quality Improvement Project Data
Based on the METRO Payment Model identified in Section 3 and water quality data obtained from the Pilot Water Quality Improvement Project, a number of predicted METRO payments are summarized in Tables 4 through 6.
Parameters
Sampled Quality
Unit
Total
Uni
Cost
Parameters
Sampled Quality
Unit
Total
Uni
Cost
Parameters
Sampled Quality
Unit
Total
Uni
Cost
Technical Memo – Task Order 5 METRO Wastewater Discharge Payment Evaluation Page 7 of 7 The summary of comparison is documented in Table 7
Table 7. Comparison of BE’s Estimate and METRO Values
Date
Date
Sampled Water Quality (mg/L)
BOD
Sampled Water Quality (mg/L)
TSS
Sampled Water Quality (mg/L)
TKN
Total Cost
Total Cost
Difference (BE's Estimate - METRO Values)
Difference (BE's Estimate - METRO Values)
Coordination with METRO
The District is currently working with METRO on the check and verification of the flow and sewer loads data provided (Appendix D). The comparison results are provided in Table 8.
Comparison of Flow and Load Data between METRO and the Districtt
Sample Date/Period
Sample Date/Period
Sample Date/Period
METRO
3/28/2019 - 4/3/20191
Lowest
METRO
3/28/2019 - 4/3/20191
Average
METRO
3/28/2019 - 4/3/20191
Highest
District
3/21/2019
3/21/2019
Note: 1. METRO conducted seven samples during this period, the lowest, average, and highest sample values during this period was documented.
It is highly recommend the District to implement the water quality improvement project to other lift stations.

